
In this article, we will discuss poverty in easy way, and try to understand its various important aspects in the context of India;
So to understand well, definitely read the article till the end, and also read other articles related to our society, the link is given below. 💡 Social and Politics
“Poverty is not an accident. Like slavery and apartheid, it is man-made and can be removed by the actions of human beings.”
– Nelson Mandela
| What is poverty?
Poverty is said to be the condition when a person is unable to fulfill even basic needs like bread, clothes and house.
According to the World Bank, the lack of welfare is called poverty. And this welfare depends on many things, such as – health, education, clean water, security, housing, better means of income etc.
◾ Poverty refers to a state of deprivation, lack, or scarcity, often characterized by a lack of material resources or income, leading to an inability to meet basic needs and enjoy a decent standard of living. It is a condition where individuals or communities are unable to access adequate food, clean water, proper shelter, education, healthcare, and other essential goods and services necessary for a dignified life.
◾ Poverty can manifest in different forms, such as absolute poverty, or relative poverty, which we are going to discuss later.
Poverty is a complex issue influenced by a range of factors, including unequal distribution of wealth, limited access to education and healthcare, discrimination, social exclusion, lack of economic opportunities, environmental factors, and political and systemic failures.
It affects individuals, families, and communities, hindering social development, perpetuating inequality, and posing significant challenges to sustainable development and social justice.
| Classification of Poverty
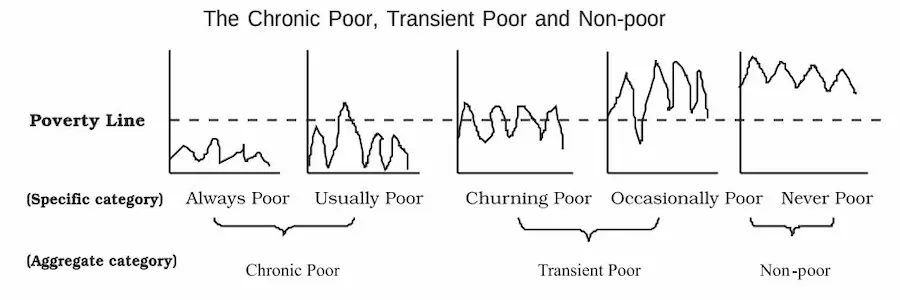
You can understand by looking at this chart that some people are always poor, while some people are generally poor, due to getting work for few days in a year or month, they cross the poverty line.
However, despite this, since they are usually poor, that is why it is called chronic poor.
Similarly, there are some people who often cross the poverty line. And some people are usually above the poverty line but there comes some time in the year when they come under the poverty line. Such people are kept in the category of transient poor.
Such people who are always above the poverty line are called non-poor.
| types of poverty
Mainly poverty can be divided into two parts – (1) Relative Poverty , and (2) Absolute Poverty .
(1) Relative Poverty – It is a social and comparative view of poverty, which is the standard of living compared to the economic standards of the population living in a given environment, hence it is a measure of income inequality.
It means to say that if one who earns 1 lakh rupees a month compares himself with one who earns 1 crore rupees a month, then only poor will be seen in front of him. That is why poverty cannot be ascertained accurately from this.
(2) Absolute Poverty – It presents a true picture of poverty. Because if a person is not able to earn enough that he is able to fulfill even his basic needs, then he will be considered completely poor.
In 1990, the poverty line was created by the World Bank on the basis of income which was one dollar per day. In 2015 it was raised to $1.90 a day. That is, since 2015, if a person is not able to earn at least $ 1.90 per day, then he will be considered poor.
However, it is important to know here that the definitions and methods of measuring poverty are or may be different in different countries.
Talking about India, here also an imaginary line like poverty line has been made, all the people living below that line are considered poor. Let us understand this in detail;
| What is poverty line in India?
The poverty line in India is based on consumer expenditure and is estimated by the task force of NITI Aayog on the basis of data obtained by the National Sample Survey Office ( under the Ministry of Statistics and Program Implementation).
In other words, poverty in India is measured on the basis of consumer expenditure surveys of the National Sample Survey Office. Thus, a poor family in India is one whose expenditure is less than the level of a particular poverty line.
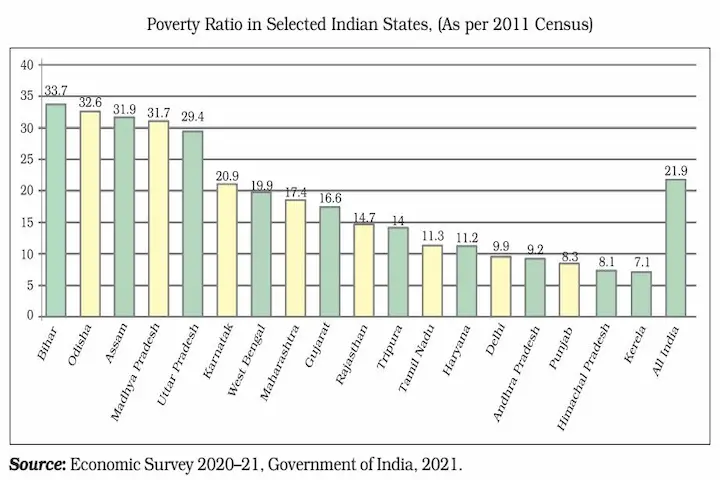
Apart from this, the ratio of the number of poor in the total population is also calculated, which is in the form of percentage, it is called poverty ratio or head count ratio . (examples can be seen in the chart below)
| history of poverty line
The concept of poverty line was first discussed by Dadabhai Naoroji before independence. He used the cost of living of the prison as its basis.
He evaluated the food being given to the prisoners in the jail at market prices and tried to reach the poverty line by making some changes in this jail subsistence cost.
In 1962, the Planning Commission set up a working group to estimate poverty at the national level, and it created a poverty line of Rs 20 per person per year for rural areas and Rs 25 for urban areas.
VM Dandekar and N. Rath conducted the first systematic assessment of poverty in India in 1971 based on data from the National Sample Survey (NSS) of 1960-61.
He argued that the poverty line should be met with an expenditure that is sufficient to provide 2250 calories per day in both rural and urban areas.
Alagh Committee (1979) : A task force was constituted by the Planning Commission in 1979 for the purpose of poverty estimation, headed by Y. K. Alagh did it. They created a poverty line for rural and urban areas on the basis of nutritional requirements.
| region | calories | Minimum Consumption Expenditure (Rs. per person per month) |
| Rural | 2400 | 49.1 |
| urban | 2100 | 56.7 |
The chart shown above shows nutritional requirements and associated consumption expenditure based on the 1973-74 price levels recommended by the Alagh Committee. At that time it was thought that the price level would be adjusted as inflation rises in the future.
Lakdawala Committee (1993): In 1993, D.T. An expert group for poverty estimation headed by Lakdawala suggested that (i) consumption expenditure should be calculated on the basis of calorie consumption as before; and (ii) state specific poverty lines should be drawn and updated using the Consumer Price Index of industrial labor (CPI-IW) in urban areas and the Consumer Price Index of agricultural labor (CPI-AL) in rural areas;
Tendulkar Committee (2009): In 2005, another expert group for poverty estimation was constituted by the Planning Commission under the chairmanship of Suresh Tendulkar.
This was done because the earlier consumption pattern was in line with the previous 1973-74 poverty line, while the consumption pattern of the poor had changed significantly since that time.
Also, earlier the poverty line was created assuming that health and education would be provided by the state, whereas now the private sector was also providing it.
This committee recommended the use of estimates based on a mixed reference period, calculation based on the consumption of the following items:* Cereals, pulses, milk, edible oils, non-vegetarian items, vegetables, fresh fruits, dry fruits , sugar, salt and spices, other food, intoxicants, fuel, clothing, footwear, education, medicine (non-institutional and institutional), entertainment, personal and toilet goods, other goods, other services and durable goods.
Note* – Under the Mixed reference period method, five low frequency items (clothing, footwear, other durable goods, education and institutional health expenditure) are surveyed in the last 365 days, and all others in the last 30 days Objects are surveyed (which has been discussed above). That is why it is called mixed reference period.
On the other hand, if all the items are surveyed on the basis of last 30 days, then it is called Uniform reference period method. Before the Tendulkar Committee, the same term was used to determine the poverty line.
The overall poverty line, where earlier, was based on the expenditure on buying food in rural and urban areas of 2400 calories and 2100 calories respectively. At the same time, the Tendulkar Committee has now defined the poverty line on the basis of expenditure on food, education, health, transport etc.
This is how the Tendulkar Committee calculated the new poverty line for rural and urban areas of each state.
To do this, it used data on the value and amount of consumption of the goods described above * by the population. and concluded that the all-India poverty line in 2004-05 was Rs 446.68 per person per month in rural areas and Rs 578.80 per month in urban areas.
Due to this, the percentage of population below the poverty line for the year 2004-05 on the basis of Lakdawala committee has changed according to Tendulkar committee. You can see how much changed in the chart below;
| Committee | Rural | urban | gross |
| Lakdawala Committee | 28.3% | 25.7% | 27.5% |
| Tendulkar Committee | 41.8% | 27.5% | 37.2% |
From the above chart you can understand that according to Lakdawala committee 27.5% of the people in India were living below poverty line at that time but according to Tendulkar committee it was 37.2%.
That is why, in later years, instead of estimating the poverty line on the basis of Consumer Price Index of Industrial Workers (CPI-IW) and Consumer Price Index of Agricultural Labor (CPI-AL) in rural areas, Tendulkar Committee methods were used. Which was something like this till 2011-12;
| year | Rural | urban |
| 2004-05 | 447 rupees | 579 rupees |
| 2009-10 | 673 rupees | 860 rupees |
| 2011-12 | 816 rupees | 1000 rupees |
According to this chart, if a rural person is not able to spend Rs 816 per month and urban person Rs 1000 per month in 2011-12, then it means that he is living below the poverty line.
On the other hand, according to the Tendulkar Committee, the percentage of people living below the poverty line was 29.8% in 2009-10 and 21.9% in 2011-12 (which is about the declining percentage of poverty in India). tells).
Rangarajan Committee 2012: In 2012, the Planning Commission constituted a new expert panel on poverty estimation.
This was done so that (1) there is an alternative method, if any, to identify the level of poverty; (2) examine the differences between consumption data and the National Accounts aggregates provided by the National Sample Survey Office, (3) review international poverty estimation methods, and (4) recommend how these methods may be linked to eligibility for various poverty alleviation schemes made by the Government of India.
The committee submitted its final report in 2014. And this report rejected the Tendulkar Committee estimate of poverty levels in India.
The report states that in 2011-2012 29.5% of the population was living below the poverty line whereas according to the Tendulkar Committee the percentage below the poverty line for 2011-12 was only 21.9% , which means that In India, 3 out of 10 people were poor in 2011-12.
| Statistics Related to India
Although the figures of poverty have also been given according to the Tendulkar Committee above, but since the most recent committee is the Rangarajan Committee and although they rejected the assessment of the Tendulkar Committee, for which they were also criticized, yet their estimates are in a way be adapted.
So according to Rangarajan Committee’s 2011-12 estimate, if an urban person spends less than Rs 1,407 (i.e. around Rs 47 per day) in a month, he will be considered poor, whereas according to Tendulkar committee it is only Rs 1000. was.
Similarly, if a rural person spends less than Rs 972 per month (i.e. around Rs 32 per day) in a month, he will be considered poor, whereas according to Tendulkar committee it was only Rs 816 per month.
Overall, according to the Rangarajan Committee, in 2011-12, there were a total of 363 million people living below the poverty line in India, compared to 269 million according to the Tendulkar Committee.
| Since the data for the survey which was to be held in 2017 has not been made public so far, the data till 2011-12 is available officially, in the chart below you can see the state wise comparison between 2004-05 and 2011-12. can;
| State | 2004-05 (%) | 2011-12 (%) | How much decreased (%) |
| Andra Pradesh | 29.9 | 9.2 | 20.7 |
| Arunachal Pradesh | 31.1 | 34.7 | -3.6 |
| Assam | 34.4 | 32 | 2.4 |
| A state in Eastern India | 54.4 | 33.7 | 20.7 |
| Chhattisgarh | 49.4 | 39.9 | 9.5 |
| Delhi | 13.1 | 9.9 | 3.2 |
| Goa | 25 | 5.1 | 19.9 |
| Gujarat | 31.8 | 16.6 | 15.2 |
| Haryana | 24.1 | 11.2 | 12.9 |
| Himachal Pradesh | 22.9 | 8.1 | 14.8 |
| Jammu and Kashmir | 13.2 | 10.4 | 2.8 |
| Jharkhand | 45.3 | 37 | 8.3 |
| Karnataka | 33.4 | 20.9 | 12.5 |
| Kerala | 19.7 | 7.1 | 12.6 |
| Madhya Pradesh | 48.6 | 31.7 | 16.9 |
| Maharashtra | 38.1 | 17.4 | 20.7 |
| Manipur | 38 | 36.9 | 1.1 |
| Meghalaya | 16.1 | 11.9 | 4.2 |
| Mizoram | 15.3 | 20.4 | -5.1 |
| Nagaland | 9 | 18.9 | -9.9 |
| Odisha | 57.2 | 32.6 | 24.6 |
| Puducherry | 14.1 | 9.7 | 4.4 |
| Punjab | 20.9 | 8.3 | 12.6 |
| Rajasthan | 34.4 | 14.7 | 19.7 |
| Sikkim | 31.1 | 8.2 | 22.9 |
| Tamil Nadu | 28.9 | 11.3 | 17.6 |
| Tripura | 40.6 | 14.1 | 26.5 |
| Uttar Pradesh | 40.9 | 29.4 | 11.5 |
| Uttarakhand | 32.7 | 11.3 | 21.4 |
| West Bengal | 34.3 | 20 | 14.3 |
| all india | 37.2 | 21.9 | 15.3 |
From the above chart you can understand that according to Lakdawala committee 27.5% of the people in India were living below poverty line at that time but according to Tendulkar committee it was 37.2%.
That is why, in later years, instead of estimating the poverty line on the basis of Consumer Price Index of Industrial Workers (CPI-IW) and Consumer Price Index of Agricultural Labor (CPI-AL) in rural areas, Tendulkar Committee methods were used. Gaya which till 2011-12 was something like this;
Q. Why is it important to measure poverty?
For any nation that wants the welfare of its citizens, it becomes very important to measure poverty; Some important reasons are as follows-
- Poverty estimation is important as it helps to track the impact and success of various government schemes launched to eliminate poverty.
- With its help, the shortcomings of the ongoing schemes can be overcome and better solutions can be found.
- Poverty estimates are used to formulate new plans that will ensure poverty alleviation from the society.
- As the Constitution of India promises a equitable society, the assessment of poverty helps in identifying the weaker sections of the society and also presents a clear picture to the public.
- Overall poverty assessment is a part of poverty alleviation.
| causes of poverty in india
The vicious circle of poverty – Due to poverty, the level of savings is already low or not, so there is very little or no money left to invest. In this way a person is able to get out of this vicious cycle of poverty. Because extra money is needed to get out of poverty.
Low natural resource potential – If the sum of income generating assets (which includes land, capital and labor of different levels) cannot provide income above the poverty line, then one will always be poor.
Lack of access to social services – Lack of public access to social services such as health, education and inequality in the ownership of physical and human assets add to the problems of poverty. Because poor people are not able to get proper benefits of these services due to lack of information and knowledge and corruption in public offices.
Lack of access to institutional credit – Banks and other financial institutions tend to favor lending to poor people because of the fear of not getting the loan repaid. As institutional credit is out of reach, the poor have to take loans from landlords and other unregulated sources at very high rates of interest, making their condition worse.
Price rise or inflation – Rising prices reduce the purchasing power of money and thus the real value of money earnings. This is because what he used to buy earlier for Rs 10, now he has to pay Rs 12-13 for the same. This further increases the financial burden on the poor people.
Lack of employment – High degree of poverty is directly related to unemployment. Because if there will be no income but spending will be necessary to survive, then the situation is sure to get worse. All sectors have to suffer the consequences of unemployment.
Rapid population growth – Rapid growth in population means – slow growth in GDP and hence slow improvement in the average standard of living. In addition, increasing population increases consumption and reduces national savings, which adversely affects capital formation and limits the growth of national income. To what extent population growth has worsened the situation, read the article ‘Population Problems and Solutions’.
Decreased agricultural productivity – Due to small and scattered farms, lack of capital, use of traditional methods of agriculture, illiteracy, etc., the level of production in agriculture is low. This is the main reason for poverty in rural areas because most of the people are associated with agriculture.
Lack of education – Poverty is also closely related to education and there is a cyclical relationship between the two. How much a person will earn in today’s time depends to a great extent on his education. But poor people do not have funds for human capital investment and thus their income is also limited by this.
Social Practices – Rural people often spend more percentage of their earnings on social practices like marriages, funerals etc. and also take more loans to meet these needs. As a result they live in debt and poverty.
Colonial reasons – First the Mughals and other foreign robbers plundered India and the British made up what was left. The British plundered India in an institutional way – pauperizing the farmer, destroying the textile industry, or rather, he did not allow industrialization in India. In this way, even when India became independent, there was poverty, hunger, malnutrition at its peak, from which even today it has not fully emerged. climatic reasons
Climatic Reasons – All the states with the highest poverty (such as Bihar, Uttar Pradesh, Odisha, Chhattisgarh, Jharkhand etc.) all usually suffer from natural calamities such as floods, droughts, earthquakes, cyclones, etc., and also poverty contributes to its growth.
| Measures taken for poverty_alleviation and employment generation in India
Poverty was also one of the major challenges after independence. Economic growth [that is, rapid growth in GDP and per capita income] from the 1950s to the first half of the 1960s was the basis for this. At that time it was believed that through industrial development and green revolution, the backward class would definitely get benefits.
The First Five Year Plan (1951–56) and the Second Five Year Plan (1956–61) came out in this, but this method was not very effective. Obviously if it had been effective, poverty would have ended.
Then the policy makers started searching for its alternative and they came to the conclusion that it can be ended only through special types of poverty alleviation schemes or programs.
Then the work of increasing this new policy started through the third-fourth five year plan. In this sequence, ‘grains for work ‘ became an important program in the 1970s . After this, many schemes were brought, most of them failed. Let us discuss the most important of them all;
Rural Employment Generation Program – It was started by Khadi Village Industries Commission in 1995. Through this a target of creating 2 lakh jobs was set.
Pradhan Mantri Rozgar Yojana – It was started in 1993. Under this, educated unemployed from rural and urban areas can take loans to start any type of enterprise. Its special thing is that the rate of interest is very low and there is a system to repay it in 7 years in easy installments.
Prime Minister’s Employment Generation Program (PMEGP) – This new scheme was created in the year 2008 by merging the above mentioned two schemes- Pradhan Mantri Rozgar Yojana and Rural Employment Generation Program.
Talking about the objective of its scheme, it was brought with the objective of creating employment opportunities in both rural and urban areas of the country through the establishment of new self-employment or small enterprises.
So that as much as possible rural and urban unemployed youth get employment at the same place.
Goden Jubilee Employment Scheme – Under this there are two main schemes – (1) Swarnjayanti Shahari Rozgar Yojana and (2) Swarnjayanti Gram Swarozgar Yojana.
(1) Swarnajayanti Shahari Rozgar Yojana – This scheme has been implemented on 1st December 1997. Its objective is to provide gainful employment to the urban unemployed or underemployed persons by providing opportunities for self-employment, or wage employment.
Three schemes already being run in urban areas – Nehru Employment Scheme (NRY), urban basic services for the poor and Prime Minister Integrated Urban Poor Elimination Scheme have been included in this new scheme.
The National Urban Livelihoods Mission was launched by the Ministry of Housing and Urban Affairs, Government of India on 23rd September, 2013 to replace the existing Swarna Jayanti Shahari Rozgar Yojana .
In 2016 its name was changed to DAY-NULM i.e. Deendayal Antyodaya Yojana – National Urban Livelihoods Mission . However, despite all this, its aim remained to remove poverty.
(2) Swarnjayanti Gram Swarozgar Yojana – This is also a self-employment program. It was established in April, 1999. Its name was changed to National Rural Livelihood Mission in the financial year 2010-11. With effect from March 29, 2016, its name was changed to DAY-NRLM i.e. Deendayal Antyodaya Yojana – National Rural Livelihoods Mission .
Despite changing the name so many times, there has been no change in its original objective, which is to remove poverty. Under this, the rural poor are made part of self-help groups and their capacity building is done through training and skill development.
At the same time, it tries to raise rural poor families above the poverty line by providing them income generating assets through a combination of bank and government financial assistance.
Mahatma Gandhi National Employment Guarantee Scheme (MNREGA) – It was started in the year 2005. The objective of this important program of the government is to enhance the livelihood security of households in rural areas. An adult member of every household who chooses to do unskilled work can get at least 100 days of paid employment in a year under guarantee.
One-third of this is made up of women. This scheme not only provides wage employment but also strengthens natural resource management through work. Its main purpose is to remove the causes of long-term poverty such as drought, deforestation and land erosion, to promote sustainable development.
Pradhan Mantri Jan-Dhan Yojana – This scheme was started in the year 2014 to connect all the countrymen with the banking system. So far about 42 and a half crore bank accounts have been opened under this scheme.
Many types of facilities are provided under this bank account, such as life insurance and accident insurance etc. This insurance is given on Rupay debit card.
Pradhan Mantri Kaushal Vikas Yojana (PMKVY) – This scheme was launched by the Government of India in July 2015. Under this, a plan was made to train one crore unskilled youth by 2020.
The objective of this scheme is to train and provide employment to people who are less educated or drop out of school. Certificate is given after completing the training course and this certificate is valid throughout the country.
National Old Age Pension Scheme – The government gives pension to the elderly people (above 60 years) for the purpose of providing social security.
This scheme was started in the year 1995. It is implemented jointly by both the central and state governments. According to government data, at present 3.5 crore people in the country are getting the benefit of old age pension scheme.
Pradhan Mantri Awas Yojana – This scheme is a scheme of the Government of India, through which poor people living in cities will be provided houses according to their purchasing power. The scheme was launched on June 25, 2015. Its aim is to provide houses to all by 2022.
Indira Awas Yojana ; Under this , assistance is provided for the construction of houses to the people living below the poverty line . In 2016, it was renamed as Pradhan Mantri Gramin Awas Yojana or Pradhan Mantri Awas Yojana (Gramin).
Ayushman Bharat Yojana – According to statistics, more than 60 percent of the population of our India has to pay for their own health and hospital expenses as they do not have any kind of insurance cover in the name of health protection. .
Apart from using their income and savings, people borrow money or sell their assets to meet their healthcare needs. This increases poverty. Keeping this in mind, this scheme was brought so that such a large population can get good quality health services without facing any financial hardship.
Pradhan Mantri Jan-Arogya or Ayushman Bharat Yojana provides an insurance cover of up to Rs 5 lakh per family per year for secondary and tertiary hospitalization. Under this scheme, a target has been set to cover more than 50 crore people from more than 10 crore families.
| NITI Aayog’s strategy
NITI Aayog proposed a vision document to remove poverty in the year 2017, in which a plan was made to remove poverty by the year 2032. According to this document, it will be necessary to work in three phases to remove poverty –
- Correct enumeration of the poor so that the exact number of poor in the country can be ascertained.
- There is a need to bring effective schemes to eradicate poverty.
- Monitoring or inspection of the schemes implemented should be done, so that the correct status remains to be known.
Q. Why is poverty not being eradicated completely?
There is no one reason behind poverty not being eradicated from India, but there have been or have been many such reasons due to which poverty has not been completely eradicated in India, let us understand some of the important reasons;
Lack of proper assessment of the poor – Since independence, poverty is being assessed and many committees have been constituted for this, but no assessment has been permanent and authentic, every new committee brings a new assessment. and which is either at variance with or rejecting the previous assessment.
For example, according to the Tendulkar Committee of 2011-12, 21.9 percent of the people in the country are below the poverty line while according to the Rangarajan Committee this figure is 29,5 percent. In such a situation, the problem comes, with which data to move forward.
Unbridled Corruption – Corruption is a common problem or a common thing in India, loopholes are found in even the best schemes and they are not allowed to reach the right beneficiaries.
Many rural people are not even aware that the village head or headman is raising MGNREGA money in his name. Similarly, a lot of fraud has also come to the fore related to an ambitious scheme like Ayushman Bharat.
Lack of awareness – If anyone can eliminate corruption, then it is the people themselves, but sometimes due to lack of awareness, they themselves promote corruption.
Apart from this, in the absence of correct information, the right beneficiaries do not even know which schemes are being run in their interest. One of the reasons for the failure of many schemes is that they do not reach the right beneficiaries.
Lack of implementation or proper monitoring – Many schemes are implemented but after that there is no one to see what is the progress of that plan or whether that plan is working or not. Years later, the government remembers and then a new scheme is brought in its place.
| Closing Remarks
It is not that poverty is not reducing in the country, such as if we look at the Global Multi-Dimentional Poverty Index 2018 (MPI ) released by the United Nations Development Program (UNDP), according to it, the year 2005-06 and More than 270 million (27 crore) people in India have been lifted out of poverty between 2015-16.
Apart from this, good work has also been done in the MSME sector. Where it is being told that about 12 crore people are engaged in employment. And to bring the farmer out of poverty, the government has said to double his income by 2022. If it does, it will make a big difference.
Nevertheless, a coordinated effort will be needed to completely eliminate poverty from India. If it is left to the government alone, then it will not work. So let’s hope that the words of NITI Aayog come true according to which poverty will be completely eradicated from India by 2031-32.
| Overall this is the state of poverty in India, hopefully this article will create a better understanding of poverty in you. A link to other important articles is being given below, be sure to read it too.
◼️◼️◼️
Other Important Articles
Article Based On,
भारत में हर 10 में से 3 व्यक्ति गरीब: रंगराजन समिति
https://www.prsindia.org/tags/rangarajan-committee
How Are Poor People Identified?
Report of Dr. Rangarajan Commission
India’s Poverty Profile – world bank
https://ncert.nic.in/ncerts/l/khec104.pdf
https://ncert.nic.in/textbook/pdf/ihss203.pdf
https://ncert.nic.in/textbook/pdf/iess203.pdf
https://ncert.nic.in/textbook/pdf/keec104.pdf
https://niti.gov.in/sites/default/files/2018-12/presentation-for-regional-meetings-NITI-AAYOG.pdf
![Stock Exchange Concept Explained [BCS 6/15] Eng.](https://wonderhindi.com/wp-content/uploads/2023/07/cropped-image-businessman-sitting-by-table-cafe-analyzing-indicators-laptop-computer-while-using-smartphone_171337-5599-440x264.webp)
![डीएनए और आरएनए [DNA and RNA] : अंतर एवं समानताएं](https://wonderhindi.com/wp-content/uploads/2022/03/dna-vs-rna-440x264.webp)
![Flag Code of India : Everything you should know [UPSC]](https://wonderhindi.com/wp-content/uploads/2023/07/modern-elegant-wavy-indian-flag-background_1055-7111-440x264.webp)


